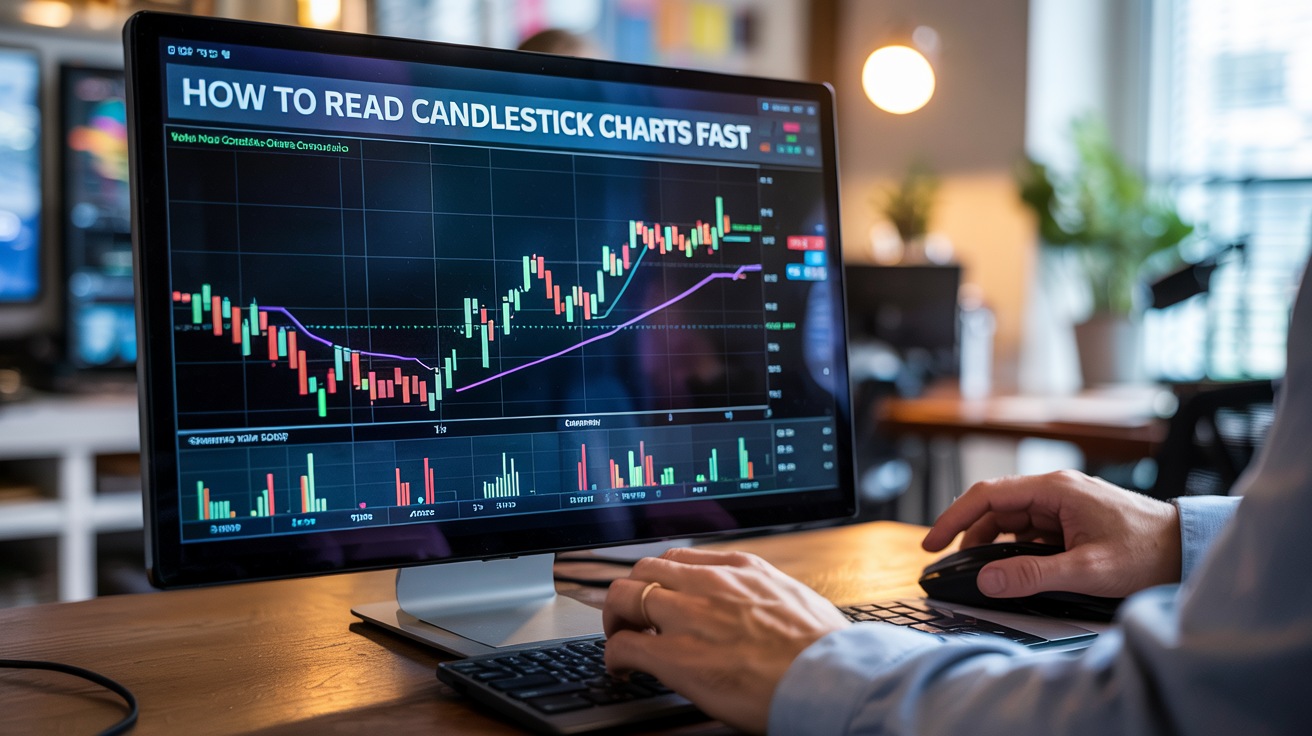
Clearly, candlestick charts quickly summarize price movements. In fact, the shape and color of each candle reveal market sentiment at a glance. Therefore, learning to read them quickly can give traders an edge.
What Is a Candlestick Chart?
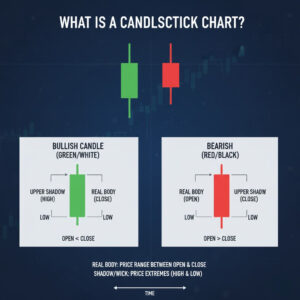
In detail, each candlestick covers one trading period and shows the open, high, low, and close prices. In fact, the candle is colored (green/white for up, red/black for down) to show the price direction.
Key Parts of a Candlestick
Each candlestick has three main parts: the body, the wicks (or shadows), and the color.
The Body
For example, the body is the rectangle that shows the open-close range. A long body means the price moved a lot, a short body indicates little net change.
The Wicks (or Shadows)
For example, wicks are lines above and below the body, showing the high and low. Of course, a very long wick suggests the price reached an extreme but then pulled back.
Color Meaning
Typically, color tells price direction: green/white means the close was higher than the open (price rose), and red/black means the close was lower (price fell). Therefore, you can immediately tell if prices went up or down by looking at candle colors. For example, many green candles in a row usually indicate an uptrend, while many red candles suggest a downtrend.
Common Candlestick Patterns
In practice, traders watch for candlestick patterns:
-
Bullish Engulfing: A two-candle pattern where a small bearish candle is followed by a larger bullish candle that covers the first candle’s body; signals a bullish reversal.
-
Hammer: A single candle with a small body and a long lower wick, usually at the end of a downtrend; signals a bullish reversal.
-
Doji: A candle where the open and close are almost the sameig.com; this reflects indecision as buyers and sellers balance each other. Alone it’s neutral, but after a strong trend it can hint at a reversal.
How to Read Them Fast and Effectively
-
Determine the trend. First, check whether the market is trending up, down, or flat.
-
Identify key candles. Next, look for significant patterns at support or resistance levelsig.com.
-
Confirm before acting. Also, never act on a pattern until it finishes formingdummies.com; use tools like volume or RSI to verify momentum, and set a stop-loss.
-
Practice and tools. Finally, practice is key: the more you study candles, the faster you’ll recognize them. Over time you’ll see common patterns instantly.
Conclusion
In short, by focusing on each candle’s body, wicks, and color, you can quickly understand what happened during that period. Over time and with practice, reading candlesticks becomes an effective way to spot trading opportunities. Ultimately, candlesticks provide a summary of market sentiment.